Comparative Review of Leading Data Analysis Tools
By Sheila Morgan | Published: 2024-Q3 | Category: Data Analysis Tools
About Data Analysis Tools
Data analysis tools enable users to inspect, cleanse, transform, and model data to discover useful information, inform conclusions, and support decision-making. These tools range from simple spreadsheets to complex business intelligence platforms and programming environments.
Scoring Criteria
- → Ease of Use
- → Visualization Capabilities
- → Data Handling & Manipulation
- → Integration & Connectivity
- → Scalability
- → Community & Support
- → Cost-Effectiveness
The Best Data Analysis Tools
 #10
#10
Apache Spark
By Apache Software Foundation
An open-source, distributed computing system designed for fast, large-scale data processing and analytics.
Platforms & Use Cases
Platforms: Windows, macOS, Linux, Cloud Platforms (Databricks, AWS EMR, etc.)
Best For: Big Data Processing, Machine Learning at Scale, Real-time Data Processing, ETL on Large Datasets, Interactive Querying
Key Features
- ✓In-Memory Processing: Performs computations in memory, significantly faster than disk-based engines like Hadoop MapReduce.
- ✓Unified Engine: Supports SQL queries (Spark SQL), streaming data (Structured Streaming), machine learning (MLlib), and graph processing (GraphX).
- ✓Multiple Language APIs: Provides APIs for Scala, Java, Python, R, and SQL.
Scorecard (Overall: 7.4 / 10.0)
Pricing
Open Source
Contact Vendor
- Full framework access
Limitations: Requires infrastructure (clusters) to run, Complexity in setup and management
Managed Services (e.g., Databricks, AWS EMR)
$-1.00 / Varies (Usage-based)
- Easier deployment
- Managed infrastructure
- Additional tooling
Pros
- + Extremely fast for large-scale data processing
- + Highly scalable distributed architecture
- + Unified platform for diverse analytics tasks
- + Supports multiple programming languages
- + Active open-source community
Cons
- - Complex to set up and manage infrastructure
- - Requires programming and distributed systems knowledge
- - Not primarily a visualization tool
- - Can be resource-intensive (memory)
Verdict
"The leading engine for big data processing and scalable analytics, essential for handling massive datasets but requires technical expertise and infrastructure."
KNIME Analytics Platform
By KNIME AG
An open-source platform for data integration, processing, analysis, and exploration using a visual workflow paradigm.
Platforms & Use Cases
Platforms: Windows, macOS, Linux
Best For: Data Integration, ETL (Extract, Transform, Load), Data Blending, Machine Learning, Visual Workflow Creation
Key Features
- ✓Visual Workflow Editor: Drag-and-drop interface for building analysis pipelines using nodes.
- ✓Extensibility: Integrates with R, Python, SQL, Spark, and other tools; large library of community nodes.
- ✓Open Source Core: Free and open analytics platform with optional commercial extensions.
Scorecard (Overall: 7.9 / 10.0)
Pricing
Analytics Platform
Contact Vendor
- Visual workflow creation
- Data access & transformation
- Analysis & visualization nodes
- Scripting integration
Limitations: Collaboration and deployment features require paid server
Business Hub (formerly Server)
$-1.00 / Contact Vendor
- Collaboration
- Automation
- Deployment
- Management
Pros
- + Free and open-source core platform
- + Intuitive visual workflow approach
- + Highly extensible and integrates well with other tools (Python, R)
- + Strong data preparation and ETL capabilities
Cons
- - Visualization capabilities less advanced than dedicated BI tools
- - Can have a higher learning curve for complex workflows
- - Performance might lag on very large datasets without optimization or server
Verdict
"An excellent open-source option for building repeatable data workflows visually, particularly strong in data integration and preparation."
 #8
#8
SAS Viya / SAS 9
By SAS Institute
A comprehensive and long-standing suite of software for advanced analytics, multivariate analyses, business intelligence, data management, and predictive analytics.
Platforms & Use Cases
Platforms: Windows, Linux, Cloud (Viya)
Best For: Advanced Statistical Analysis, Predictive Modeling, Data Mining, Business Intelligence, Clinical Trials Analysis, Risk Management
Key Features
- ✓Advanced Analytics: Industry-leading capabilities in statistics, econometrics, forecasting, and optimization.
- ✓Data Management: Robust tools for accessing, transforming, and managing large datasets.
- ✓Scalability & Reliability: Proven performance in enterprise environments handling complex tasks.
Scorecard (Overall: 7.3 / 10.0)
Pricing
Custom Licensing
$-1.00 / Contact Vendor
- Modular components
- Industry solutions
Limitations: Generally considered expensive, Complex licensing models
Pros
- + Unmatched depth in statistical analysis and modeling
- + Highly reliable and validated procedures
- + Strong data handling capabilities
- + Excellent support for regulated industries
Cons
- - Very expensive
- - Steep learning curve (SAS language)
- - Interface can feel dated compared to modern BI tools
- - Less focus on interactive visualization than Tableau/Power BI
Verdict
"A powerhouse for deep statistical analysis and enterprise-level modeling, particularly in regulated industries, but comes with significant cost and complexity."
 #7
#7
Looker
By Google Cloud
A business intelligence and data analytics platform that provides a governed data modeling layer (LookML) for consistent reporting and analysis.
Platforms & Use Cases
Platforms: Web
Best For: Business Intelligence, Data Exploration, Embedded Analytics, Data Applications, Governed Data Access
Key Features
- ✓LookML Modeling Layer: Centralized, reusable data definitions ensure consistency across analyses.
- ✓Browser-Based Interface: Fully web-based platform for development and consumption.
- ✓Integration with Google Cloud: Leverages Google Cloud infrastructure and integrates with services like BigQuery.
Scorecard (Overall: 7.3 / 10.0)
Pricing
Custom
$-1.00 / Contact Vendor
- Platform usage
- User types (Viewer, Standard, Developer)
Limitations: Pricing is not publicly listed, requires consultation
Pros
- + Strong data governance via LookML
- + Highly scalable, especially with BigQuery
- + Web-based and collaborative
- + Good for embedding analytics
Cons
- - Pricing can be high and lacks transparency
- - Requires learning LookML for development
- - Visualization options less flexible than Tableau
Verdict
"A powerful, scalable platform emphasizing data governance, best suited for organizations needing consistent, reliable metrics across teams, especially those using Google Cloud."
 #6
#6
Qlik Sense
By Qlik
A data analytics platform enabling users to explore data, discover insights, and create interactive visualizations and dashboards using an associative engine.
Platforms & Use Cases
Platforms: Windows, Web, Mobile
Best For: Business Intelligence, Data Discovery, Interactive Dashboards, Self-Service Analytics, Guided Analytics
Key Features
- ✓Associative Engine: Allows users to explore data freely without predefined hierarchies, revealing hidden insights.
- ✓Responsive Design: Dashboards adapt automatically to different screen sizes (desktop, tablet, mobile).
- ✓Self-Service Capabilities: Empowers business users to create their own visualizations and analyses.
Scorecard (Overall: 7.4 / 10.0)
Pricing
Business
$30.00 / per user/month, billed annually
- Self-service analytics
- Shared workspaces
- Automated reporting
Enterprise SaaS
$-1.00 / Contact Vendor
- Advanced governance
- Multiple deployment options
- Scalability
- API access
Enterprise Client-Managed
$-1.00 / Contact Vendor
- On-premises or private cloud deployment
- Full control over environment
Pros
- + Powerful associative engine for data exploration
- + Intuitive user interface for consumers
- + Strong self-service BI capabilities
- + Flexible deployment options
Cons
- - Can be expensive
- - Steeper learning curve for complex development compared to some competitors
- - Data preparation features less mature than Power BI
Verdict
"A strong BI contender, particularly valued for its unique associative engine that facilitates fluid data exploration and discovery."
 #5
#5
Microsoft Excel
By Microsoft
A ubiquitous spreadsheet application with built-in features for data organization, calculation, basic analysis, and charting.
Platforms & Use Cases
Platforms: Windows, macOS, Web, Mobile
Best For: Basic Data Analysis, Spreadsheet Management, Charting, Data Entry & Organization, Budgeting
Key Features
- ✓PivotTables: Tool for summarizing, exploring, and presenting large amounts of data.
- ✓Formulas & Functions: Extensive library of functions for calculations and data manipulation.
- ✓Charting Tools: Variety of chart types for visualizing data.
Scorecard (Overall: 7.3 / 10.0)
Pricing
Microsoft 365 Personal
$69.99 / per year
- Includes Excel, Word, PowerPoint, etc.
- 1 user
Microsoft 365 Family
$99.99 / per year
- Includes Excel, Word, PowerPoint, etc.
- Up to 6 users
Office Home & Business (One-time)
$249.99 / one-time
- Classic versions of Office apps including Excel
Pros
- + Widely available and familiar
- + Easy to learn for basic tasks
- + Good for small datasets and quick analysis
- + Strong calculation engine
Cons
- - Limited scalability for large datasets (row limits, performance issues)
- - Less sophisticated visualization options
- - Data manipulation can be manual and error-prone
- - Not ideal for complex statistical analysis or automation
Verdict
"An essential tool for basic data tasks and spreadsheet management, but limited for large-scale or complex data analysis compared to specialized software."
 #4
#4
R (with RStudio)
By R Foundation & Community / Posit (formerly RStudio)
An open-source programming language and environment specifically designed for statistical computing, analysis, and graphics.
Platforms & Use Cases
Platforms: Windows, macOS, Linux
Best For: Statistical Modeling, Data Visualization, Bioinformatics, Academic Research, Exploratory Data Analysis
Key Features
- ✓Statistical Capabilities: Comprehensive collection of built-in statistical techniques and models.
- ✓ggplot2 Package: Powerful and flexible system for creating elegant data visualizations.
- ✓CRAN Repository: Extensive repository of user-contributed packages for various analytical tasks.
Scorecard (Overall: 8.6 / 10.0)
Pricing
Open Source (R Language)
Contact Vendor
- Full access to language and CRAN packages
RStudio Desktop (Open Source)
Contact Vendor
- Integrated development environment (IDE) for R
RStudio Desktop Pro / Posit Workbench
$995.00 / per user/year (indicative)
- Commercial license
- Enhanced features
- Professional support
Pros
- + Excellent for statistical analysis and modeling
- + Superior visualization capabilities (ggplot2)
- + Vibrant academic and research community
- + Free and open-source core
- + Extensive package library (CRAN)
Cons
- - Steeper learning curve than GUI tools
- - Memory management can be challenging for very large datasets
- - Less intuitive for general business intelligence tasks compared to Tableau/Power BI
Verdict
"The standard for statistical computing and academic research, offering unparalleled statistical libraries and excellent visualization capabilities, primarily for users comfortable with coding."
 #3
#3
Python (with Data Science Libraries)
By Python Software Foundation & Community
A versatile, open-source programming language with extensive libraries (Pandas, NumPy, Matplotlib, Scikit-learn) for comprehensive data analysis, manipulation, and modeling.
Platforms & Use Cases
Platforms: Windows, macOS, Linux
Best For: Data Manipulation, Statistical Analysis, Machine Learning, Data Visualization, Automation, Big Data Processing
Key Features
- ✓Pandas Library: Provides high-performance, easy-to-use data structures (DataFrames) and data analysis tools.
- ✓NumPy Library: Fundamental package for scientific computing, supporting large, multi-dimensional arrays and matrices.
- ✓Extensive Ecosystem: Vast collection of libraries for visualization (Matplotlib, Seaborn), machine learning (Scikit-learn, TensorFlow), and more.
Scorecard (Overall: 8.9 / 10.0)
Pricing
Open Source
Contact Vendor
- Full access to language and all libraries
- Complete flexibility and control
Limitations: Requires programming knowledge, Steeper learning curve than GUI tools
Pros
- + Extremely versatile and powerful
- + Massive community and library support
- + Excellent for complex data manipulation and machine learning
- + Completely free and open-source
- + Highly scalable
Cons
- - Requires coding skills
- - Steeper learning curve initially
- - Visualization setup can be more complex than GUI tools
Verdict
"The go-to choice for data scientists and analysts needing maximum flexibility, power, and control over the entire analysis workflow, especially for complex tasks and machine learning."
 #2
#2
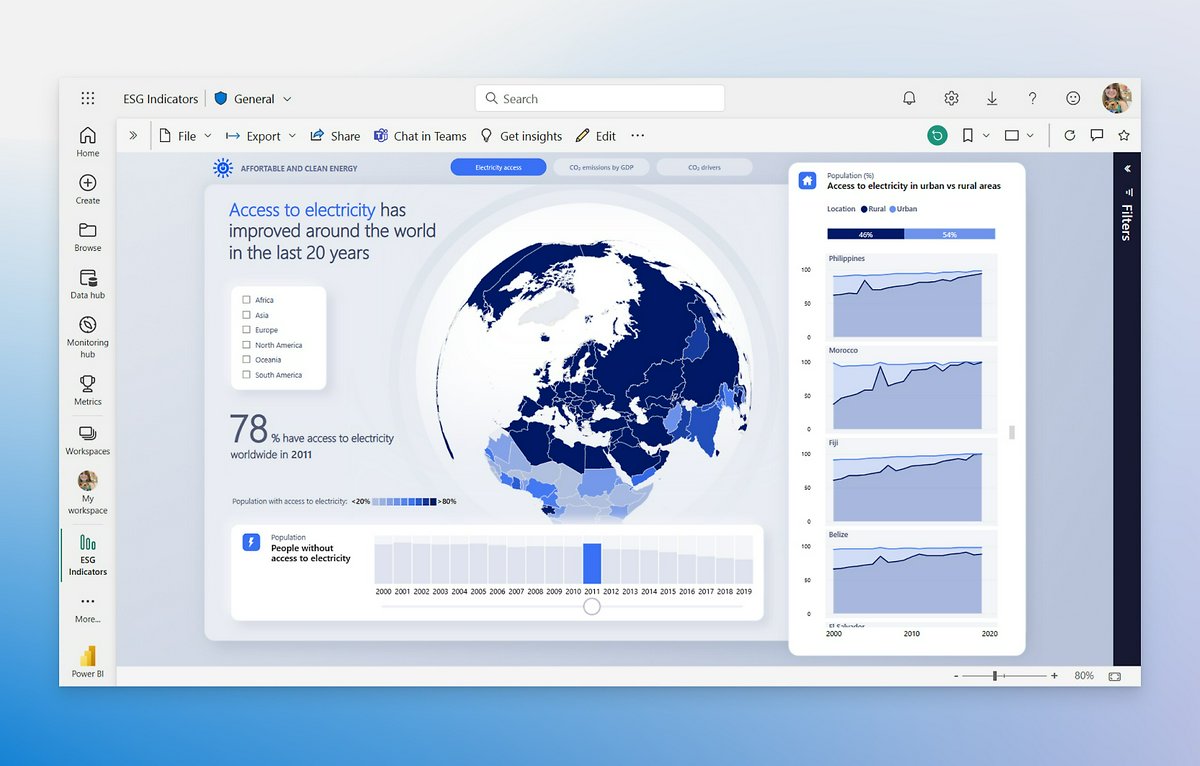
Microsoft Power BI
By Microsoft
A comprehensive business analytics service offering interactive visualizations, data preparation, and BI capabilities, tightly integrated with the Microsoft ecosystem.
Platforms & Use Cases
Platforms: Windows, Web, Mobile (iOS, Android)
Best For: Business Intelligence, Reporting, Dashboarding, Data Modeling, Self-Service Analytics
Key Features
- ✓Power Query: Robust data transformation and preparation engine.
- ✓DAX Language: Powerful formula language for custom calculations and data modeling.
- ✓Integration with Microsoft Stack: Seamless connection with Excel, Azure, Office 365, and Dynamics.
Scorecard (Overall: 8.4 / 10.0)
Pricing
Free
Contact Vendor
- Author reports with Power BI Desktop
- Connect to hundreds of data sources
Limitations: Limited sharing and collaboration
Pro
$10.00 / per user/month
- Publish reports
- Share dashboards
- Collaborate with workspaces
Premium Per User
$20.00 / per user/month
- Pro features plus larger model sizes
- Paginated reports
- Advanced features
Premium Capacity
$4995.00 / per capacity/month
- Dedicated capacity
- Larger scale deployment
- Advanced administration
Pros
- + Excellent value for money
- + Strong data modeling and preparation capabilities
- + Deep integration with Microsoft products
- + Frequent updates and feature additions
Cons
- - Desktop authoring tool is Windows-only
- - DAX language has a learning curve
- - Interface can feel cluttered at times
Verdict
"A powerful and cost-effective BI solution, especially strong for organizations invested in the Microsoft ecosystem."
View Top Ranked Software
Watch a short ad to unlock the details for the #1 ranked software.
 #1
#1
Tableau
By Salesforce
An interactive data visualization tool focused on business intelligence, known for its powerful and intuitive visual analytics capabilities.
Platforms & Use Cases
Platforms: Windows, macOS, Web
Best For: Business Intelligence, Data Visualization, Dashboarding, Exploratory Data Analysis
Key Features
- ✓Interactive Dashboards: Create dynamic and shareable dashboards.
- ✓Drag-and-Drop Interface: User-friendly interface for creating visualizations without coding.
- ✓Data Connectivity: Connects to a wide variety of data sources, including databases, spreadsheets, and cloud services.
Scorecard (Overall: 8.3 / 10.0)
Pricing
Creator
$75.00 / per user/month, billed annually
- Full analytics capabilities
- Tableau Desktop & Prep Builder
- One Creator license for Server/Cloud
Explorer
$42.00 / per user/month, billed annually
- Explore governed data
- Author from existing workbooks
- Collaborate
Viewer
$15.00 / per user/month, billed annually
- View and interact with dashboards
- Receive subscriptions
Pros
- + Best-in-class data visualization
- + Intuitive user interface
- + Strong community and support
- + Wide range of data connectors
Cons
- - Can be expensive for large teams
- - Data preparation capabilities less robust than specialized tools
- - Requires Creator license for full development
Verdict
"The leader in data visualization, ideal for organizations prioritizing interactive dashboards and exploratory visual analysis."

Final Thoughts
The data analysis landscape offers diverse tools, from user-friendly BI platforms like Tableau and Power BI, to powerful programming environments like Python and R, and specialized engines like Spark for big data. Excel remains essential for basic tasks, while KNIME offers a visual workflow alternative. The best choice depends heavily on specific needs regarding data volume, complexity, user technical skill, budget, and desired output (visualizations vs. models vs. reports).